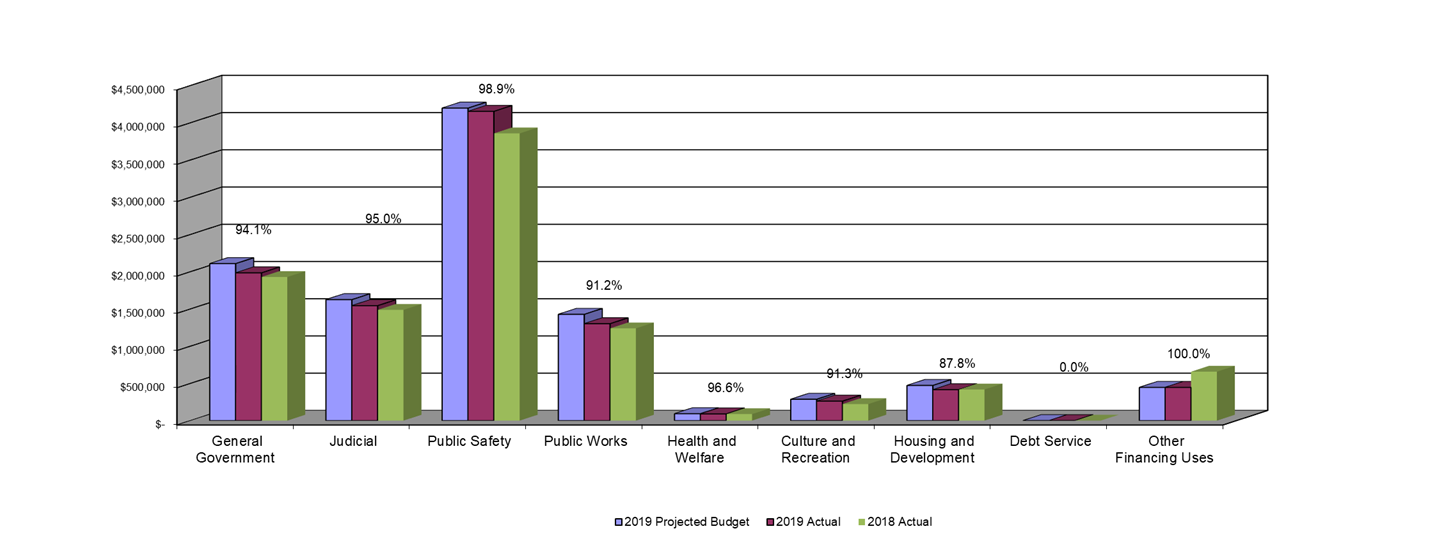
| General Fund Expenditures by Category | ||||||||||||||||
| March 2019 Year to Date | ||||||||||||||||
| Projected Budget vs. Actual - with 2018 Comparisions | ||||||||||||||||
|
|
||||||||||||||||
| 2019 Projected Budget | 2019 Actual | % | 2018 Actual | |||||||||||||
| General Government | $ 2,108,317 | $ 1,984,703 | 94.1% | $ 1,928,622 | ||||||||||||
| Judicial | 1,624,854 | 1,543,923 | 95.0% | 1,487,126 | ||||||||||||
| Public Safety | 4,197,081 | 4,152,905 | 98.9% | 3,857,125 | ||||||||||||
| Public Works | 1,427,249 | 1,301,720 | 91.2% | 1,239,022 | ||||||||||||
| Health and Welfare | 93,000 | 89,884 | 96.6% | 87,834 | ||||||||||||
| Culture and Recreation | 286,719 | 261,646 | 91.3% | 222,282 | ||||||||||||
| Housing and Development | 472,605 | 414,938 | 87.8% | 418,186 | ||||||||||||
| Debt Service | - | - | 0.0% | - | ||||||||||||
| Other Financing Uses | 446,305 | 446,305 | 100.0% | 657,118 | ||||||||||||
| 10,656,128 | 10,196,024 | 95.7% | 9,897,315 | |||||||||||||